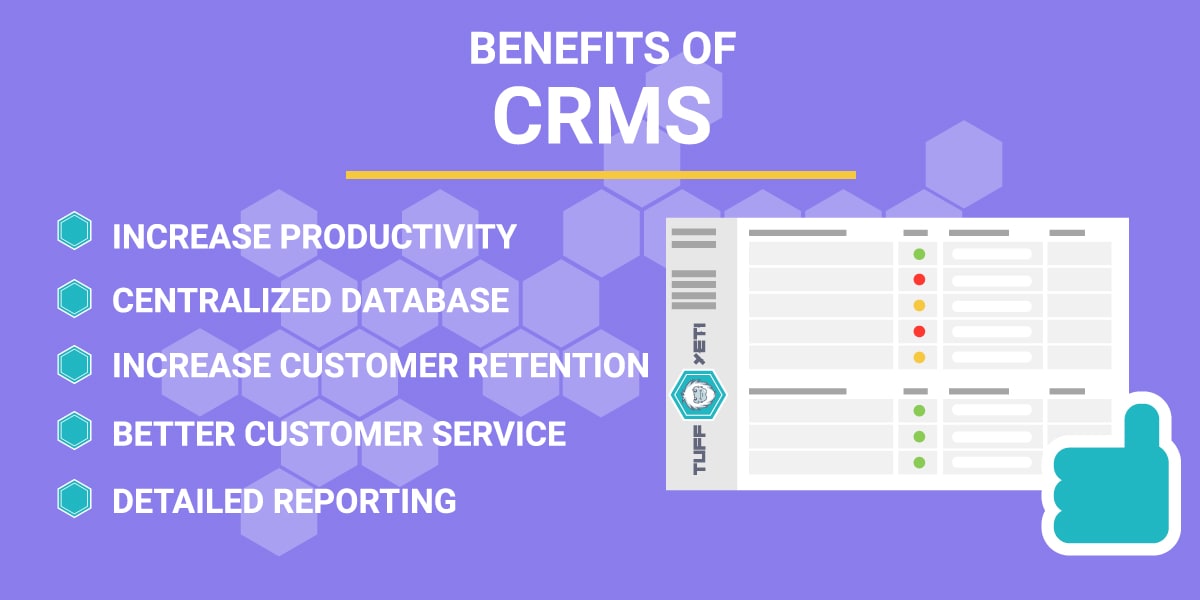
How to Make an Infographic: 9 Infographic Design Tips
If you’re looking to diversify your content marketing strategy, adding infographics into your content creation plan is a great way to do that. Done right, they can add value to your current posts and help people find the information they need quickly, in a visually compelling way.
But how do you make an infographic for your website that actually does what you want it to, especially if you’re not a designer?
Well, there are many infographic makers to choose from, like Canva, that provide you with various templates to pick from that can help you design one quickly for your needs.
However, you’ll still have to add the content to your infographic, something that will need to be on point if you want to communicate the information that can be complex in an easy-to-digest format.

Here are my infographic design tips to help you make a good-looking and informative infographic for your audience.
- Design for your audience
- White space is a good thing
- Research you data and facts thoroughly
- Make your information tell a story
- Use the right design template for the information
- Charts and graphs help visualize the data
- Don’t be too wordy
- Focus on a single topic or niche
- Format & optimize for sharing online
#1 Design for your audience
When designing an infographic, it’s always best to create with your audience in mind.
If your audience is technically minded, you can add language and specific terms they will understand. If you want to capture a wider audience, use an everyday language you know everyone can understand.
Of course, then there’s the type of infographic you are making. If it’s for displaying stats, use charts and graphics that reflect this.
If it’s more for someone to take action, like ‘how to fix a leaking tap’ or ‘how to pick the right web host for you’, then a flowchart infographic with multiple options and routes to follow to get to your final result is a good option.
Making sure you make it easy for your target audience to consume the information or complete the task you want them to do will help it be shared more and generate traffic to your site.
#2 Avoid distracting images / graphics (white space)
Being handy at designing, one piece of advice that’s always stuck with me is “Don’t be afraid of white space“.
We often try to fit everything we can into the space we have, but this usually leaves designs feeling cluttered, making them confusing to look at and claustrophobic.
That doesn’t mean you can’t add all the necessary information; simply don’t clutter your infographic designs with unneeded images or text. Add pictures that help compliment the text, are instantly recognizable, and add value to your designs.
As the old saying goes: “A picture is worth a thousand words”, which couldn’t be any more relevant to creating infographics for your website.
White space is good, people! Let your designs breathe.
#3 Don’t mislead with false information – research your data
With your designs now getting a breath of fresh air, it’s time to start planning what you want to write.
Many of the best infographics contain statistics about various topics and information you can use to understand a subject or topic quickly.
Before you add your stats to your design, you’re going to need to take the time to research the facts and make sure that you are getting your values from reputable sources, and be honest.
If you don’t put effort into ensuring that the information you are promoting is correct, it could harm your reputation more than help it.
Be sure to check your data sources thoroughly and ask yourself a few questions before adding it in:
- Can I trust the information?
- Am I allowed to share the information?
- Is the information worth sharing?
Remember to cite your sources and give credit where credit is due. It’ll help people trust your infographic and help your audience learn more about the stats you’ve used if they need to.
A win, win for everyone.
#4 Make the information flow through storytelling
Adding a lot of random facts and figures to an image isn’t going to cut it. It will be confusing, cluttered, and not easy to comprehend.
If you’re creating a graphic telling someone the steps they need to take to complete a task, put them in a logical order, and don’t make them look elsewhere for the next step.
This clear interpretation of data is where storytelling and the flow of information in your infographic come into play.
If you’re in the marketing business, you’ll probably already know how storytelling can drive more sales and keep people reading your content.
The same goes for infographics. Combining the design, data, and information in a format that explains the data can give you insights into what you need to do or how to do something better.
Let the visuals help tell the story supporting your text. Logically formatting your data and using text and images together will help tell the story you want your audience to read.
#5 Change design template based on the information
How you display your information isn’t going to be the same for every infographic you create online.
You will need to change up your infographic templates and designs to reflect the information and audience you are creating your designs for.
Here’s a few types of infographics:
- Comparisons
- Lists
- Statistical
- Timelines
- Geographic
- Hierarchical
Each one helps tell the story of your data differently to get the message across to your users easily and quickly. Which one you pick for your design is often determined by the type of information you are trying to promote.
Don’t get caught up too much in finding the correct infographic template type, it could be that your data fits well in multiple styles.
Take a list of the top 10 countries to visit, for instance. You could use a geographical chart of the world and highlight the areas showing where they are. Or you could simply create a list-style template with graphics to help identify each country.
Find one that roughly fits your data and go with it. If it doesn’t look right, you can always change it before publishing. More often than not, when it comes to any type of design, you’ll go through many design and approval processes before publishing anyway. Design is fluid, not set in stone.
#6 Use visual data charts where needed
This infographic tip is all about using the right images for the right information. If you’re creating a statistical infographic about how many online businesses succeed, have ratios and percentages, and compare different years, then it can be best to use charts.
Charts and diagrams can help give you that immediate impact and feedback that is easier to understand when compared to other data visually rather than when written down.
And the great thing is that there are many different types of charts to display data, so you can swap and choose which to use depending on the kind of data you want to display.
Here’s a few different types of charts and graphs:
- Bar Chart
- Pie Chart
- Venn Diagram
- Scatter Chart
- Line Chart
- Column Chart
- Heat Map
There are many others that help with data visualization; simply figure out what you want to achieve with your data and choose the appropriate chart to fit your data set.
#7 Keep text to a minimum
There are thousands of infographics covering all topics, displaying data for hundreds of different industries and helping people find the information they need.
When creating the written content for your design, sometimes less is more. You’ll want to find the sweet balance between providing just the right amount of information that is helpful while also complimenting the images and charts that are the visual storytellers.
Not everyone gets the balance right, but visual elements should be the star of the show when designing good infographics that attract attention, as being too wordy can be distracting.
And even though you might only have a few hundred words on a graphic, make sure you spell check or use a tool like Grammarly to grammar check your content. There’s nothing worse than publishing an image with words, sharing it, and promoting it only to find you’ve got a spelling mistake. Once it’s out there, it can be hard to change the error.
#8 Convey a single topic
Even though some infographics can include multiple sections of data, typically, it’s best to stick to one overall topic or niche down into a single area.
Why? Cause this keeps distractions to a minimum and focuses on providing value rather than just information.
Say you cram everything you know about web design into a single infographic. For one, it will be huge; secondly, it’s not what infographics are used for. If you want to part your knowledge about web design or being a real estate agent, write a blog post.
However, if you want to show:
- The anatomy of a high converting landing page
- The cost of home staging
You can easily do these single topics using graphically compelling images and supporting text that’s not too wordy.
Another term you’ve probably heard time and time again is ‘Keep it simple stupid (KISS)‘. It can relate to every industry and many different scenarios; why overcomplicate something if you get the same results with something simple.
Don’t overcomplicate things, and you’ll turn your good graphic into a great one. Of course, keeping it too simple and not providing enough valuable information isn’t good either; you’ll need to find that balance.
#9 Format and optimize your graphic for sharing
When creating your infographic for sharing and promoting, you will want to make sure you publish it in the right format.
JPG and PNG are formats that can easily be linked to and shared across various social media platforms. Of course, not all infographics are static. You can create dynamic or interactive infographics; if this is the case, then be sure to make them easily linked to.
You can always add a custom embed code to make it even easier for people to share or use your infographics on their websites. It’s easy to create and can add a link back to your site, helping with your off-page SEO efforts and backlinking strategy.
Embed code is great, but also is the addition of social share buttons that can help your audience share what they have found with their audiences, helping spread the word of how great your business is.
When it comes to promoting your infographic be sure to:
- Share it on social media
- Share it with your email list
- Submit it to a infographic directory
- Hit up other websites that might find the information useful for their audience
Do this and more, and you’ll have created a successful infographic for your website.
Infographic Design Tips Conclusion
Making an infographic doesn’t have to be complicated. Thanks to some of the best infographic creators like Venngage and Canva, you don’t even need to have any design skills.
These online infographic tools let you pick from hundreds of templates to suit different industries and data visualization scenarios. Simply select your template, then use the drag n drop editors to add your branding, images, and text and customize it to your liking.
Put into practice a few of my tips for infographic design, and you’ll be well on your way to creating a compelling design tailored to your audience and available for sharing, helping you drive more traffic back to your site and generate more leads.
Happy designing, people.